Introduction
Articular cartilage has a very limited self-healing capacity in case of injury or damage, creating a major clinical challenge. Researchers are focusing on Human Mesenchymal Stem Cells (hMSCs) because they have the potential to form new cartilage tissue, in a process called chondrogenesis. Transforming Growth Factor Beta1 (TGF-β1) is a key protein in chondrogenesis: it is produced by hMSCs in an inactive form and becomes effective when activated (aTGF-β1). There are several mechanisms of activation, among which mechanical force is one. To study this, hMSCs are placed in a structure, named scaffold, and exposed to mechanical forces that mimic daily activities in special machines called bioreactors. The scaffold design and material play a crucial role in activating TGF-β1. A very promising material is Thermoplastic Polyurethane (TPU), which is also 3D-printable. Additionally, finite element (FE) models are effective to predict local distributed forces and relative displacements – known as stresses and strains – in a scaffold under physical forces, helping to improve its design. In this study, as preliminary validation, we aim to correlate the activation of TGF-β1 in a bioreactor loaded scaffold with FE-predicted strain.
Methods
Scaffolds (Ø8mm, 4 mm height) were obtained from a 3D-printed sheet of TPU (gyroid structure, 83.1% porosity). They were filled with fibrin, a water-based gel that supports cells, covered in media containing 50 ng/mL inactive TGF-β1 and loaded in a mechanical bioreactor [1] for 6h with 10% preload plus 10%, 15% or 20% compression at 1 Hz. The media usually provides nutrients for the cells; however, in these preliminary experiments, cells were not used and therefore TGF-β1 was artificially added to the media. Unloaded controls were prepared the same way. TGF-β1 concentration was quantified in the media and inside the scaffold using ELISA DuoSet TGF-beta1 kit (R&D Systems). Scaffolds were washed with RIPA buffer to recover and quantify TGF-β1. A 3D model of the scaffold was built in Simpleware (v.2017, Synopsys) and imported in Abaqus (v2021, Dassault Systems) to create an FE model of the bioreactor-scaffold system, where pure axial displacements corresponding to the experimental compression levels were simulated. Maximum principal strain [2] was calculated in the FE model within the fibrin region surrounding the 3D printed scaffold and a median value was evaluated at each applied compression step.
Results & discussion
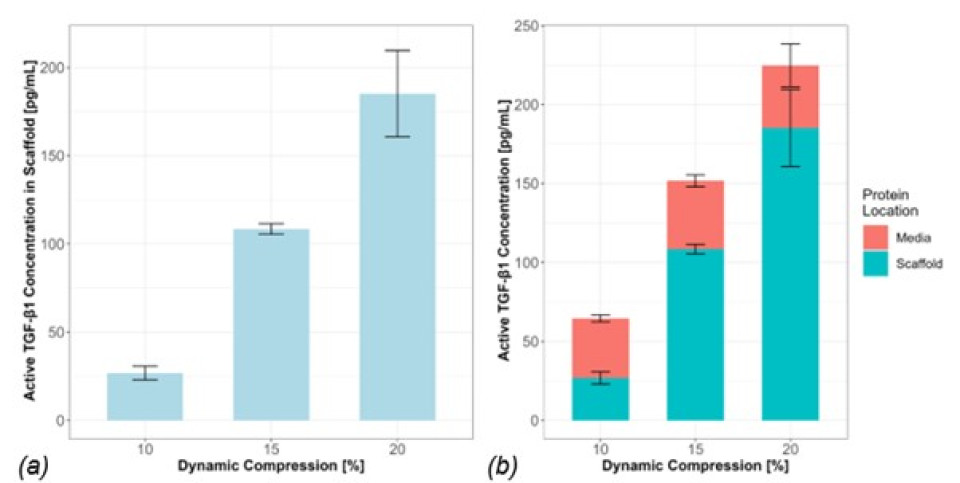
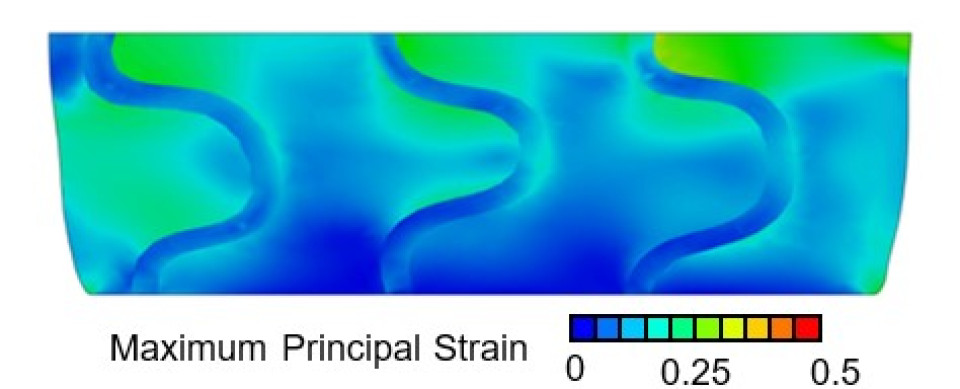
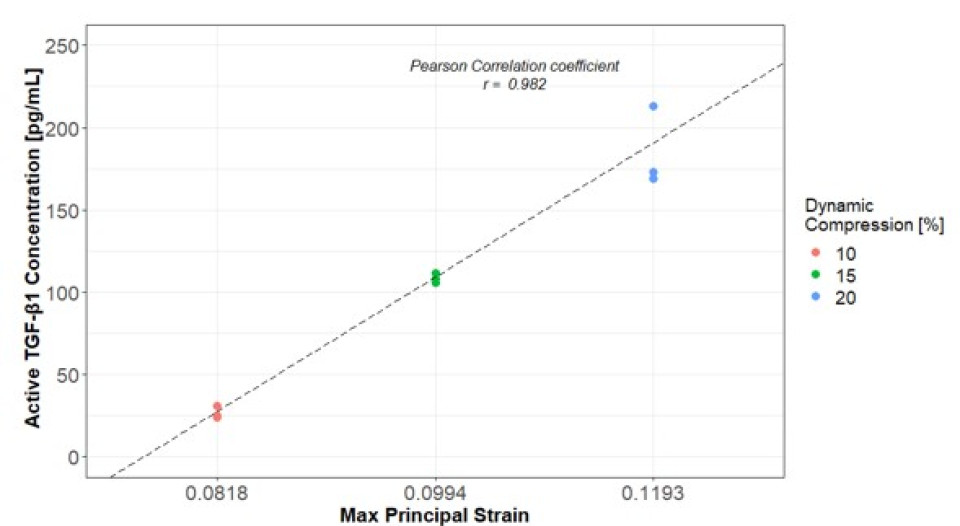
The aTGF-β1 concentration inside the scaffold increased with increasing level of compression, without statistical differences. This trend was not observed in the surrounding media (Fig.1). Preliminary FE results show strain distribution inside the scaffold under different loading protocols, with higher maximum principal strain in the fibrin region due to lower stiffness (Fig.2). The correlation between aTGF-β1 values in the scaffold and FE-predicted median strain resulted in a correlation coefficient of 0.982 (Fig.3). This high value could be due to a low number of replicates, which should be increased in future experiments. Nonetheless, the positive correlation between aTGF-β1 and strain levels is confirmed assuming constant strain and stresses over time. All experiments were conducted in cell-free scaffolds: the action on the protein is fully mechanical and no biological processes are involved, which is captured by the FE model. Further work is ongoing to assess the spatial distribution of aTGF-β1 inside the scaffold and to correlate it with the local strains.
Conclusions
Overall, a methodology to predict scaffold potential for TGF-β1 activation has been developed. This can be potentially applied to other scaffold structures to test them prior laboratory work, speeding up the scaffold optimization process.
[1] Gardner, O.F.W., et al., J Tissue Eng Regen Med, 2017
[2] Zahedmanesh, H., et al., Tissue Eng Part A, 2014
Acknowledgments
Work funded by EU-OSTASKILLS, grant No. 101034412.

Figure 1: (a) Concentration of active TGF-β1 measured inside the scaffold. (b) Concentration of active protein inside the scaffold and outside in the media. Statistical test: Wilcoxon pairwise test, n=3, p > 0.05.

Figure 2: Contour plot of section view of FE model showing maximum principal strain (mm/mm) distribution in a section of the scaffold under the 20% strain loading scenario. Strain is seen to be higher in the fibrin region compared to the stiffer scaffold region.

Figure 3: Linear regression analysis between the experimental values of active TGF-β1 and FE-predicted maximum principal strain. Pearson coefficient, r=0.982.
Quiz question
What is mechanobiology?
It is the study of living organisms.
It is a science field that investigates how living cells sense and respond to physical factors, such as forces and mechanics.
It is a branch of applied science that deals with forces producing motion.
